Tracking Success in Watershed Health Projects
Effective watershed work is a marathon, not a sprint. Choosing relevant indicators, gathering reliable data, and communicating findings clearly allow teams to learn, course-correct, and demonstrate real environmental gains. In turn, robust tracking programs create the evidence base that keeps partners motivated, regulators satisfied, and waterways on a steady path to recovery.

How to choose the right indicators, gather reliable data, and turn results into better management decisions
Why measure success at all?
Watershed restoration and protection projects often span years, involve many partners, and rely on scarce public dollars. Tracking outcomes provides accountability, shows taxpayers a return on investment, and, most importantly, tells practitioners whether their actions are improving water quality and ecosystem resilience.
Begin with clear, measurable objectives
Start by translating broad goals (“improve stream health”) into specific, time-bound targets such as “raise summertime dissolved-oxygen levels above 5 mg L⁻¹ within five years.” Well-defined objectives guide choice of metrics, sampling frequency, and budgets.
Choose indicators that match your goals
| Dimension | Typical indicators | Why they matter |
|---|---|---|
| Physical | Peak flow, base flow, channel stability, riparian buffer width | Reflect hydrologic and geomorphic responses to land-use change |
| Chemical | Nitrogen, phosphorus, pH, conductivity, dissolved oxygen | Directly tied to aquatic life criteria and regulatory standards |
| Biological | Benthic macroinvertebrate index, fish IBI, aquatic vegetation cover | Integrate multiple stressors over time, giving an “ecosystem report card” |
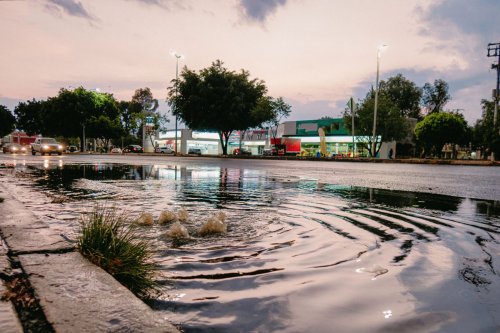
| Landscape | Percent impervious cover, forest cover, wetland extent | Point to upstream drivers of water-quality trends |
| Social/Behavioral | Number of septic upgrades, volunteer hours, adoption of agricultural BMPs | Gauge community engagement and long-term stewardship (extensionpubs.osu.edu) |
Use established frameworks and tools
-
EPA Watershed Index Online (WSIO) supplies ready-to-use, U.S-wide indicator data layers and scoring methods for comparative assessments (epa.gov).
-
USDA Forest Service Watershed Condition Framework classifies watershed condition on national forest lands and links it to targeted restoration work (fs.usda.gov).
-
ChesapeakeStat / ChesapeakeProgress dashboards show how one of the nation’s largest restoration efforts tracks dozens of metrics in near real time, providing a model for public transparency (chesapeakestat.com, chesapeakeprogress.com).
Collect data with a mix of methods
-
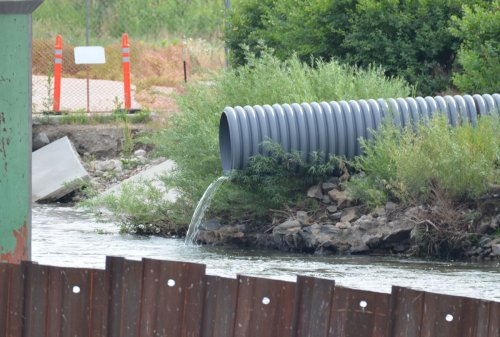
In-situ monitoring: automated sondes, grab samples, and bio-assessments provide high-quality, localized data.
-
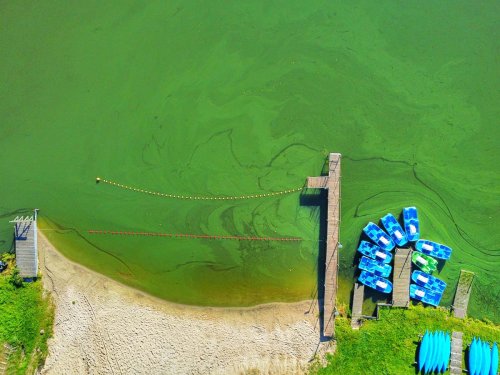
Remote sensing: modern satellites (e.g., Landsat 8-9, Sentinel-2/3) and low-cost drones now detect chlorophyll-a, turbidity, and algal blooms across large areas, filling spatial gaps in field programs (mdpi.com).
-
Citizen science & IoT sensors: community groups armed with smartphone apps and low-cost probes expand coverage while fostering public ownership of results.
Manage, analyze, and visualize information
Store data in a centralized database or cloud GIS, enforce QA/QC protocols, and automate trend analyses. Interactive dashboards, story maps, and quarterly report cards make dense data understandable to decision-makers and residents.
Practice adaptive management
Monitoring is only useful if it triggers action. Set thresholds that prompt program adjustments: tightening erosion controls, modifying salt-application rates, or expanding riparian plantings. The Chesapeake Bay Program, for example, recalibrated its nutrient-reduction strategy after the 2025 health score dipped from C+ to C in response to extreme weather and runoff patterns (apnews.com).
Tips for successful tracking programs
-
Budget realistically: devote 10-15 percent of overall project funds to long-term monitoring.
-
Keep protocols simple and repeatable: staff turnover is inevitable, so choose methods future technicians can replicate.
-
Link indicators to management levers: if you cannot act on a metric, measuring it will not help.
-
Share results early and often: transparency builds trust and can unlock additional funding.
Effective watershed work is a marathon, not a sprint. Choosing relevant indicators, gathering reliable data, and communicating findings clearly allow teams to learn, course-correct, and demonstrate real environmental gains. In turn, robust tracking programs create the evidence base that keeps partners motivated, regulators satisfied, and waterways on a steady path to recovery.